USCOM on the Ward.
One major advantage of the USCOM is that it is readily portable and therefore the USCOM can be taken to the patient rather than the patient coming to the USCOM. There are a large number of haemodynamic problems that may arise in inpatients, from the point of view of diagnosis, from guiding their therapy, and also for explaining unexpected eventualities. Let's take a look at a couple of clinical examples.
USCOM on the Medical Ward.
A 63 year-old man was admitted to the ward with a history of increasing breathlessness over two days. In the past he had suffered a myocardial infarction some four years previously and had been on digoxin and diuretics since that time for treatment of mild to moderate cardiac failure. He also had a history of hypertension for which he was on an ACE inhibitor. In the past he had been a miner and had a long-standing history of chronic obstructive pulmonary disease. His admission observations are shown below.
BP 116/68, Pulse 104, Resps 28. SpO2 of 88% on 4 l/min O2 via Hudson mask. Temp 37.1. He was using his accessory muscles of respiration. JVP was clinically elevated. The liver appeared enlarged and slightly tender. Auscultation revealed widespread crackles throughout both lower and mid zones. There were also widespread rhonchi in all areas. CXR showed increased lung markings and a general fluffiness bilaterally. Blood gas analysis showed a pH of 7.28, PaO2 of 68, PaCO2 of 32, BE –8.
This is a typical example of the clinical problem of "is it pulmonary or is it cardiac?" If we look at his USCOM results then things begin to make more sense.
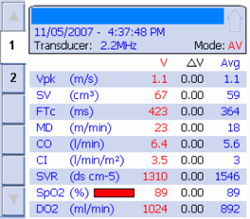
His cardiac index is 3.5 which very strongly suggests that this is not cardiac failure. His stroke volume is a reasonable 67ml and his Vpk is 1.1 which again suggests that this is not cardiac failure. His FTc is 423, which is entirely normal, while his MD at 23 suggests a borderline hyperdynamic circulation. There is no evidence of vasoconstriction as his SVR is 1310. It is far more likely, therefore, that what we're dealing with here is a primary pulmonary condition. In fact, over the next 24 hours, he developed typical lobar pneumonia.
Let's look at a second example with a very similar clinical presentation. If we look at the results they are very different from those of the case above.
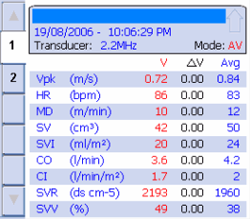
Perhaps the most obvious finding is that the cardiac index is 1.7 and the cardiac output just 3.6. The Vpk is only 0.72 which suggests a low myocardial contractility, whilst the MD of only 10 indicates a hypodynamic circulation. The stroke volume at 42 is clearly low, and when we look at the SVR it is quite apparent that the patient is markedly vasoconstricted. This is very typical of low cardiac output states.
But what about the stroke volume variation? What does an SVV of 49% mean in this case? Surely it cannot indicate that the patient is severely volume depleted? His FTc was raised at 526 (normal at this age is about 450) indicating a higher than normal preloading. In fact the patient had pulsus alternans, a classical finding in cardiac failure. Again, this is a case of taking the whole clinical picture into account rather than laying too much emphasis on just one single parameter.
USCOM on the surgical ward.
But can the USCOM help in surgical patients too? You bet it can!
Perhaps one of the commonest problems that we see is the hypotensive postoperative patient. Here the differential diagnosis lies between bleeding and other causes of hypovolaemia, and a coronary event or even pulmonary embolus, that has led to the low blood pressure. USCOM will very quickly tell us which of these it is. Hypovolaemia from whatever cause will show a low CI, a low MD, a high SVR indicating vasoconstriction, and a low FTc with raised SVV. A septic patient will show a raised CI, reduced SVR and evidence of a hyperdynamic circulation with a raised MD. We have already seen in this booklet how easily a USCOM can spot myocardial failure. A pulmonary embolus of any significance produces very similar results. Again, what we are looking for is a typical pattern of hemodynamics rather than just individual values.
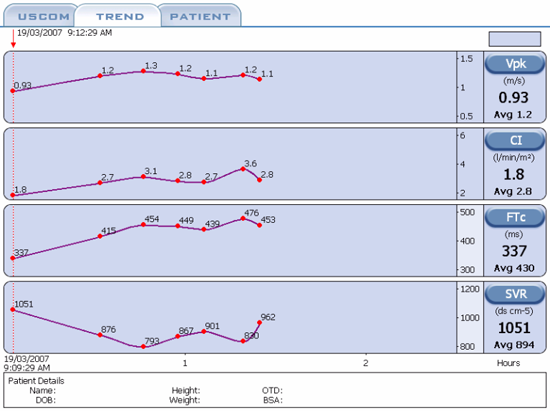
Perhaps the USCOM is of even greater value however in the patient who is simply becoming dehydrated. The BP may be normal although the pulse tends to be increased. We will see a raised SVR and a low FTc with an elevated SVV. BP and cardiac output may be maintained simply by the degree of vasoconstriction present as shown in the trend display here.
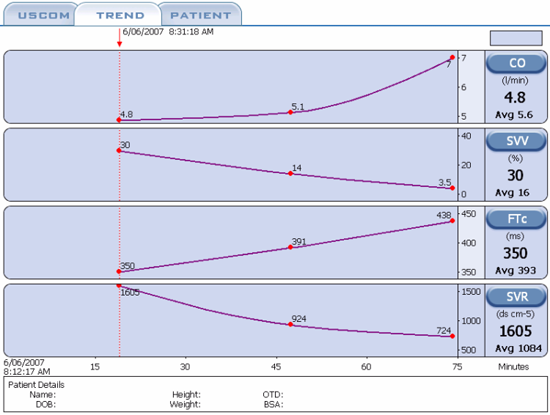
This shows the effect of giving 1L of normal saline over about 45 minutes. The CO increases from 4.8 to 7 litres, the SVV falls from 30% to just 3.5%, the FTc increases steadily from the moderately low value of 350ms to an entirely normal 438ms. But what happened to the peripheral circulation? Well the saline must have done the trick as the SVR fell by more than 50%! We now have a nicely vasodilated patient with a higher CO and better peripheral perfusion, exactly what we wanted, and achieved in under an hour with no guesswork.
So if we think the patient is dehydrated then why not give the patient a fluid challenge to see if the situation improves? Even if we were seriously concerned that the patient might already be overloaded then there is still no problem - we can just elevate the patient's legs and see if the stroke volume increases with the increased venous return. If so, then this clearly indicates the need to increase the preload, i.e. they need fluid. Should the stroke volume go down, then they are already overloaded. All we have to do is put the legs back down and no harm has been done, and now we know for certain which way to go to solve the problem. Primum non nocere – first do no harm!
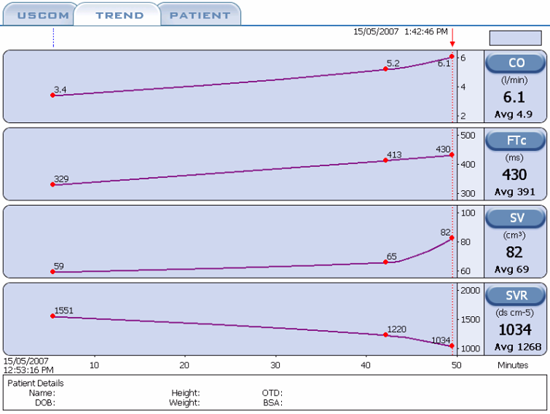
In this trend display we see a patient who was moderately hypotensive following abdominal surgery. The cause is easy to spot. We know from “The USCOM and Hemodynamics” that BP = CO x SVR. In this case the BP is low because the CO is low. The SVR is close to the upper end of normal. In this trend we see the response of the patient to simple fluid replacement. We see the CO and SV rising in line with the increasing FTc, whilst the SVR progressively falls. The sharp increase in SV in relation to FTc at the right hand end of the trace is quite typical as we approach optimum fluid loading, typically when the FTc is around 425ms.
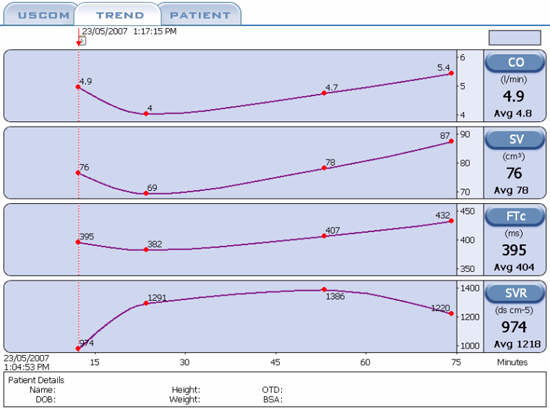
In this trend screen we see a postoperative hip-replacement patient who has been bleeding steadily in the hour following surgery and has gradually dropped her blood pressure to around 90/45. The SVR is increasing whilst the cardiac output and stroke volume are falling. At around the 20 minute mark, transfusion of whole blood commences and as the FTc rises from 382 to 432, we see the stroke volume increasing from 69 to 87ml whilst the cardiac output rises from 4 to 5.4 litres per minute. Her blood pressure gradually increased throughout this time reaching 125/65. From the trend we can see that the ideal FTc for this patient lies in the region of 425 to 450, again a fairly typical FTc in normovolaemia.
Have you noticed in all these trend displays the clearly interactive behaviour between FTc, SVV, CO, CI, SV and SVR? This is how we obtain an overall view of the circulation, look at how it behaves as a whole. Everything interacts with everything else. The trick is to “get the feel” of what the heart and circulation are saying to you. Now that you’re getting the hang of this, let’s try a couple of interesting pictures!
How did we optimise the cardiac output in this case? Can you see the Frank-Starling Laws in action here? What were the haemodynamic values at optimum loading?
|