The Hemodynamic Jigsaw!
In haemodynamics, everything is inter-related like cogs in a machine or the pieces of a jigsaw puzzle. Its only when you put all the pieces together that you see the full picture. Looking at a single piece in the puzzle, say CO, will tell you very little about what’s really going on and what needs to be done. Putting three or four key pieces together will improve our understanding. Can we put eight or more pieces into the puzzle required for a more complete understanding? Yes we can, but it becomes more complex and we need to develop a systematic and methodical way of looking at the data to allow piecing the big picture together. So where do we start?
Peripheral Demand not Central Supply.
Perhaps the first thing we need to understand is that the heart is not the leader or the primary controller of the circulation, it is just the pump. It is the consumer of electricity not the power station that determines electricity flow. When you flick the switch on your wall the current flows. How much current flows depends on how many switches you flick. It is a consumer-led economy! Haemodynamics is similar. The peripheral circulation dilates or constricts in response to the metabolic needs of the cells. It’s the circulation that flicks the switches, and the heart responds.
Generally it is the cells need for oxygen that determines the vessels tone. If a tissue needs more oxygen, then it stimulates regional vasodilation to increase the blood flow and thereby regional oxygen delivery. This vasodilation reduces the SVR. Consequently the SV increases because the afterload has reduced, and the ventricle can empty more easily. In normal health the ventricle only produces an SV of about ⅔ of the ventricular end diastolic volume, an ejection fraction of about 66%. This gives the heart some leeway to increase or decrease the SV to meet the beat to beat variations in preload and afterload.
This is an entirely mechanical effect, and doesn’t require the sympathetic system to intervene. As we know CO = SV x HR, so small variations in SVR “automatically” change SV and thus CO. If SVR decreases then SV increases, and CO rises, so from BP = CO x SVR, the BP is maintained at the normal level.
The Sympathetic System.
But what if it is not just a minor reduction in vascular tone or is not restricted to one region? In this case the fall in SVR is greater than a simple passive increase in SV can compensate for, and a further increase in flow is required by the tissues. This is when the sympathetic system kicks in.
Increased sympathetic system activity leads to an increase in heart rate (HR) and an increase in inotropy, which increases SV. (see booklet 3, “The USCOM and Inotropy”) The increased CO brings BP back up to normal, and the tissues get the increased blood flow that they have asked for; simple but crucial! The leader in this process is clearly the tissues, the heart and the sympathetic system were just responding to their demands.
This basic appreciation of how the tissues need for oxygen and blood flow is the main regulator of the circulation is absolutely central to understanding haemodynamics. Ask yourself “what is the body asking for?” Put yourself in the position of the body and see if you can understand its demands on the heart and the circulation.
Where do we start?
It might seem logical to start with CO, but do you know the normal CO for every size and age of patient that you see? No, I didn’t think so. So would CI be better? Well again, what’s the normal CI for a 60kg woman of 70 years of age? How about a 7 year old boy of 24Kg? The normal CI varies considerably with age, weight, height, body shape, normal levels of physical activity and around the times of growth spurts. Could our simple model of peripheral demand leading central supply help us here? Perhaps SVR would be a better starting point. In adults this might have merit, but the SVR is size dependant. Just look at the SVR of an infant and you’ll see what I mean; an SVR of 2000+ might seem high until you realise that a small child has far less tissue (and therefore “less taps to turn on” – see below) than an 80kg adult. Even SVRI varies enormously with age, height and weight.
So is there anything which applies across the board from infants to octogenarians? Fortunately there is, the Minute Distance (MD).
Minute Distance.
Unless you’re familiar with echocardiography, the concept of MD will be alien to you. Technically it is how far a single red blood cell travels in one minute, OK so that’s clear as mud then! But in effect, it’s the mean aortic valve flow velocity (or pulmonary valve flow velocity if you’re looking at the right side of the heart) and technically is the area under the ejection curve, the velocity-time integral, Vti, multiplied by HR.
Imagine the main water pipe coming from the reservoir to a town, the more water that is being used by the consumers, the higher the velocity of flow there must be in the pipeline. On a hot day when everyone is using the shower or filling their pool, the velocity of flow in the pipeline will be very high. At two in the morning on the other hand, the flow velocity will be very low because the consumers have all the taps turned off. The body is just the same, when the taps are all turned on, i.e. the tissues are demanding a lot of blood, the flow velocity in the aorta will be high, a high MD. The normal MD is 14 – 22 in adults, and just a little higher at 16 – 28 in kids.
OK, so a high MD equals a high demand, and a low MD presumably means a low demand. Well not so fast there. Let’s go back to the reservoir and the pipeline. What would happen if the pump was failing and couldn’t keep up with demand? Obviously, the flow velocity in the pipeline would fall. What if the water level in the reservoir was very low or the water intake to the pump was blocked? Again, a low flow velocity. So a low MD doesn’t necessarily mean a low demand. It could also mean that there was a problem with the pump or inadequate preload, or even a pulmonary embolus blocking the intake for the pump. Get the idea?
A low MD just might mean that the tissues are not asking for much blood, but unless you’ve just done an USCOM on a hypothermic patient (or on a hibernating bear!) this is not very likely. A low MD is nearly always pathological and points back at the pump or the reservoir as the cause. On the other hand, a high MD either means that the body is demanding high delivery of oxygen, as in strenuous exercise, or that some pathological process is causing excessive vasodilation as in sepsis.
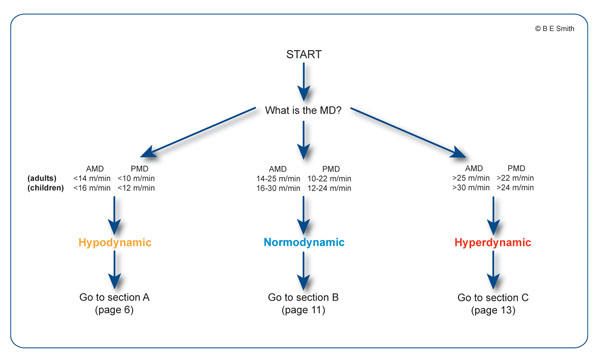
The MD immediately tells us whether the circulation is normodynamic (normal flow velocity and normal MD), hypodynamic (low flow velocity and low MD) or hyperdynamic (high flow velocity and high MD).
High, Low or Normal MD?
- Normodynamic (14–22m/min). If the MD is normal then the circulation is normodynamic and it is unlikely that there will be any major abnormality of haemodynamics or any major abnormality in the USCOM parameters. It does not however exclude minor or subtle abnormalities that have been compensated for within normal haemodynamic controls.
- Hypodynamic (<14m/min). The MD will be below 14m/min. This is usually due to inadequate venous return to the left atrium due to hypovolaemia, haemorrhage or even a pulmonary embolus, or cardiac failure. The body will be demanding more blood but it’s either not there to be delivered or the pump is failing and can’t deliver it.
- Hyperdynamic (>22m/min). The body is asking for a higher blood flow than normal so we need to ask why this is. A good example of this is during exercise. The body is burning oxygen at an increased rate so it needs a higher blood flow to deliver it. It could also be pathological however, as in cytotoxic hypoxia. The tissues are calling for more oxygen even though there is plenty being delivered by the circulation. The problem is that the tissues can’t use it.
So from this simple starting point, we can devise a decision tree that will guide us through the maze of haemodynamics allowing us to put all the pieces together? Well let’s try it.
|