Measurement of Preload.
So by now you might be thinking that the USCOM, SMII and PKR have taken us into areas of haemodynamics that we never thought we should see at the bedside. You’re dead right, but we haven’t finished yet!
What is not yet clear from our simple view of haemodynamics in the examples given above, is do we need to increase the preload further? There are several clues to the answer. If we are still on the under-loaded side (left side) of the Frank-Starling curve then further volume challenge will lead to an increase in stroke volume. If it doesn’t, then we are probably at or near the peak of the curve, or on a flat curve, but SMII will differentiate which it is. A flat curve will have a low SV and SMII, while an under-loaded patient will still have a low SV but more normal SMII (=>1.2W/m2). Can we make this even easier?
Stroke Volume Variation SVV.
SVV has been used as an index of ventricular filling. The concept is relatively simple. As the intrathoracic pressure changes with respiration, so venous return to the heart will change in a cyclical way. Increased intrathoracic pressure will lead to reduced venous return and reduced ventricular filling. This will lead to a fall in SV.
An under-loaded patient will show a greater variation in SV than a well filled patient. If we look at a typical Frank-Starling curve we can see why.
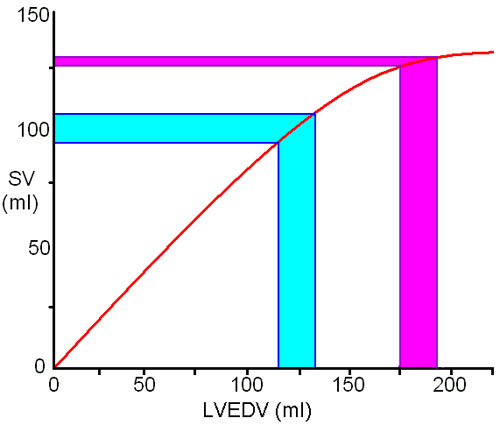
In an under-loaded patient (blue band) a 20ml change in LVEDV will lead to about 15ml variation in SV as we are on the left side of the peak in the Starling curve. If we increase preload, then the same 20ml variation in LVEDV will result in only 5ml change in SV (purple band). If we increased preload even further till we reach the plateau of the Starling curve then SVV would be imperceptible.
There is a problem with this approach however. If the change in intrathoracic pressure is small, as in normal quiet breathing, then the change in LVEDV will also be very small and a very sensitive method is required to pick up the variation in stroke volume. Fortunately, Doppler ultrasound is extremely sensitive and even minor changes in SV can be tracked by the USCOM. With positive pressure ventilation, the SVV should be more marked due to the greater changes in intrathoracic pressure and therefore in LVEDV.
Passive Leg Raising.
In either case, a simple trick is to measure the SV and then raise the patient’s legs to increase venous return. (N.B. the patient must not assist you in this, you or a helper have to do the work.) In an under-loaded patient the SV will increase whilst the SVV will decrease. If this is the case, then a further fluid challenge can be made. The leg-raising trick can be repeated as often as necessary. If the SV does not increase then we are near the top of the curve. If the worst case happens and the SV should fall, then we have an overloaded patient, but no harm has been done. We can just lower the legs again and go back to where we were. It’s not so easy to do that with an i.v. fluid bolus challenge!
|