Myocardial Contractility.
OK, so now we know how to hit the peak of the Frank Starling curve, but what if that is still not enough cardiac output? Here again, the Frank Starling curve and the USCOM tell us which way to go - increase inotropy. Now we know about inotropes, but which one and how much should be used? To answer this we need to know three things. What is the cardiac output now and what do we want it to be? What is the SVR now and what should it be? Is there a single inotrope which can do this, and if there is no single inotrope which can solve both problems then which combination of drugs do we use?
As we saw from our simple Ohm’s Law analogy, SVR is equivalent to the resistance in the circuit. If it is too low then the voltage, which is analogous to blood pressure, will be too low. What should the SVR be? The section on typical values at the end of this booklet gives the figures for each age group, but a figure of 1,000-1,600 is a good general guide. Does the patient need an increased or decreased SVR? The table below gives an indication of which drug to choose.
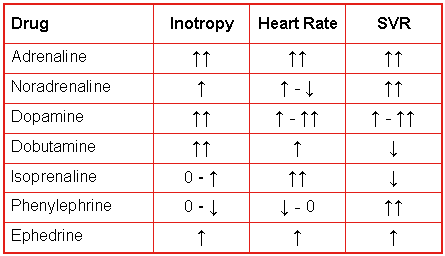
If we need increased inotropy and increased SVR then dopamine fits the bill, as would ephedrine if a lesser response would be adequate. If the SVR is already too high but we still need inotropy, then dobutamine would be a good choice.
If SVR is about right but we need a high degree of inotropy than a combination of dobutamine and dopamine would be appropriate. Other combinations can be "blended" to achieve the effect that we want, after all, we can easily measure both CO and SVR and see what progress we are making and then modify the treatment regimen accordingly.
If cardiac output is adequate but the low BP is due to low SVR i.e. excessive vasodilation, then a pure vasoconstrictor would be ideal. Which would you choose? Here, phenylephrine, or possibly noradrenaline, would seem reasonable.
Whatever you choose, the USCOM provides immediate haemodynamic feedback to allow you to fine-tune your treatment.
One question arises however. What should the cardiac output be? How do we judge this in a neonate, a child, an expectant mother or indeed a prop forward? This is where we need to know the cardiac index. The cardiac index is the cardiac output divided by the body surface area. For each square metre of body surface area we need a cardiac output of at least 2.4 litre/min/metre2, the figure being higher in children, pregnancy and some disease states such as anaemia. The section on typical values gives some guidance as to the figures appropriate to each patient, but as a general rule 2.8 to 3.4 is a good ballpark figure in adults, whilst 3.2 to 4.4 is more typical in children.

So we have now, in effect, defined a low cardiac output as a cardiac index that is below normal for that patient. By doing this we already know which way to go to treat cardiac failure, but the USCOM gives us even more help.
Preload - Myocardial Contractility - Afterload.
This simple triad is composed of the three elements which determine cardiac output. The preload, which equates to ventricular filling, can be too high or too low as we have seen. We know how to increase myocardial contractility, but how can we measure it? Stroke volume gives us some clues, but is there anything else we can use? And what after all this is afterload?
One of the figures displayed by the USCOM is the Vpk, which is the peak velocity of ventricular ejection. Imagine you wanted to throw a ball into the air. The stronger the muscles in your arm, then the faster (and higher) you could throw the ball. The speed of the ball is therefore a good indication of the strength of your arm; just ask any cricket fielder or baseball pitcher.

In the same way, the more powerful the ventricle, then the faster the blood will be ejected. Vpk tells us in a very real way how powerful the ventricle is. Vpk for the left ventricle is around 1.1 – 1.5 m/s in healthy patients. In patients with cardiac failure or low contractility/inotropy this figure might well be only 0.6 or 0.7 m/s or even less. For the right ventricle the figure would be 0.7 to 1.2 in healthy patients (see typical values).
So far so good, but what is afterload and how do we measure it? In essence, afterload is simply the work that the heart has to do to push blood into the aorta and around the body. Imagine pushing a wheelbarrow full of sand. Is it easier to push it up hill or on the level? Pushing it up a gradient is hard work and gets harder the steeper the gradient. The blood pressure in the root of the aorta (or pulmonary artery for the right ventricle) is like the gradient of the hill. A high BP means that the ventricle is pushing uphill!

But what about pushing our wheelbarrow on the flat, but first over smooth concrete and then across a muddy field? The viscosity of the blood and the degree of vasodilation of the vascular tree have the same effect. High viscosity and vasoconstriction mean hard work for the ventricle.

Hemodynamics and the USCOM take the guesswork out of estimating afterload. From our analogy to Ohm’s Law, if V = I x R then R = V/I.
For the circulation this is BP = CO x SVR and SVR = BP/CO.
The USCOM tells us how much resistance there is to the flow of blood and a sphygmomanometer can tell us the blood pressure, but the USCOM tells us something more, the minute distance.
|